We prepare a daily quant report for our trading desk, which helps us trade Bitcoin.
The report includes a range of essential statistical data such as spot and margin CVD, NPOC levels, exchange flows, funding rates, and liquidation levels.
It is designed to assist all traders in predicting upcoming market movements based on fundamental data. By combining the analysis of CVD data with liquidity, we can confidently anticipate the next price movement. Our approach in this report is geared towards the medium term, providing the opportunity to forecast price movements for the next 2 to 4 days.
We are pleased to share this report with you, along with our interpretation of the data.
Lets delve into this:
Tips : if you read daily , you will find an extraordinary edge on reading market state.
BTC CVD CHART
15m to Daily Time Frame
15m
Price: Print HL
Spot CVD : Print HL
Margin CVD : Print HL
Pattern in the LTF CVD has turned since yesterday, Initially Spot CVD participants starts buying,later follows by the margin. Additionally more bull divergence pattern built up within the same time frame(orange line).
1Hr
Price : Printing Continous HL
Spot CVD: Print HL
Margin CVD : Follows the spot and print Bullish upside push.
Following the same sentiment as it is built up in hourly time frame .
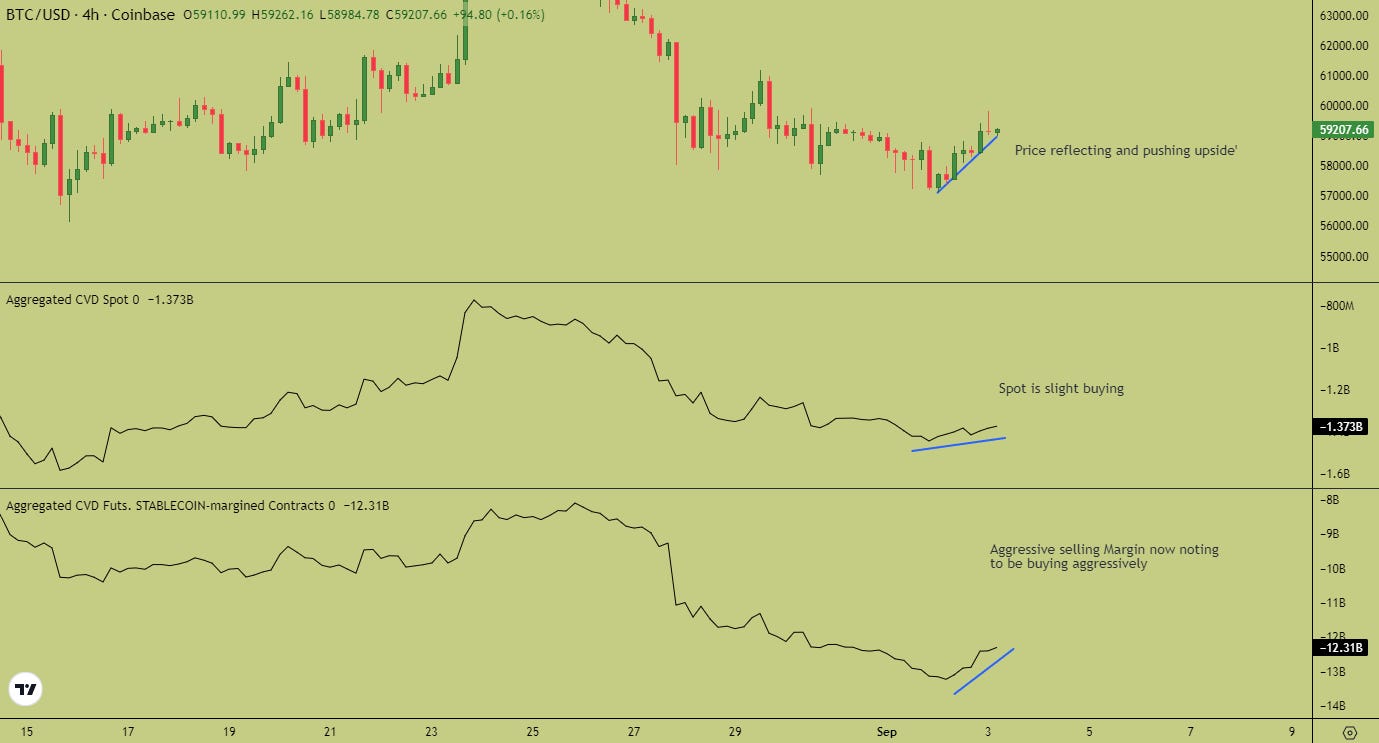
4Hr
Spot CVD: Spot slightly buying here
Margin CVD: while Margin observed to be aggressively jumped with buying pressure
Earlier selling pressure of the margin pressure diminished and now participated in aggressively buying in the price.
Daily
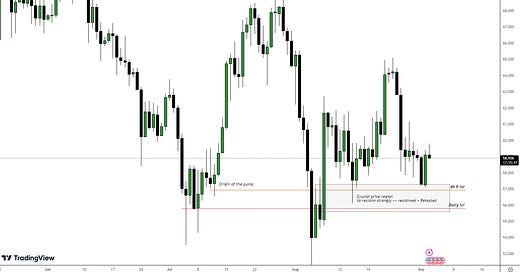
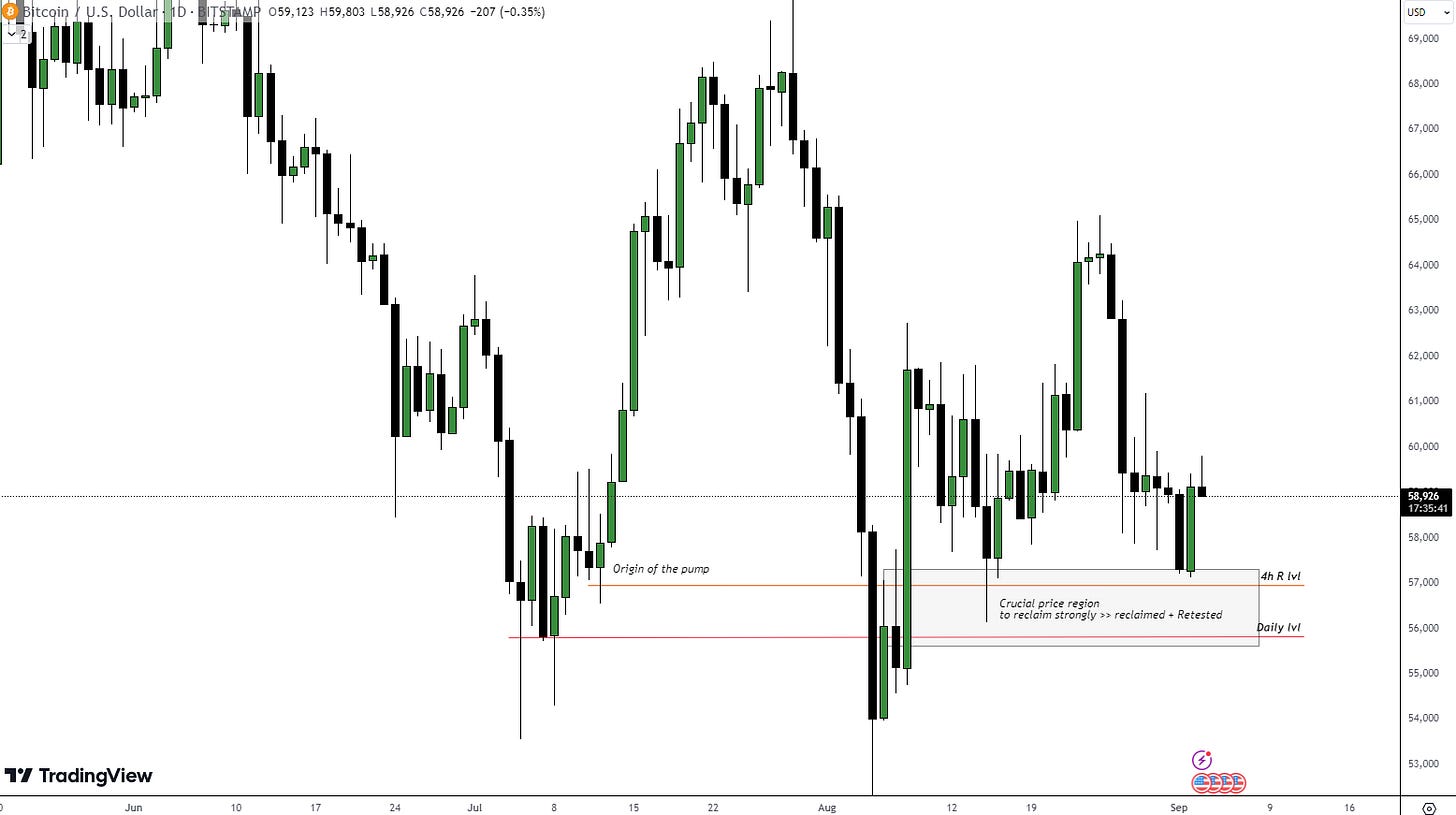
Price : Holding support and print equal lows .
Spot CVD: Print HL
Margin CVD: print LL
Daily chart bullish optimism still hold , Daily spot CVD slight tilt toward buying , same reflected in the Margin participant’s actions too.
Observation : Lead by the Daily Chart , LTF participation see some buying pressure in last 2 days. However this still not suggest the overall shift in the market structure, price still under the accumulation range resistance and bullish shift must retain in HTF structure.
Note : Cumulative Volume Delta (CVD) displays the cumulative volume changes based on the volume traded by sell aggressors versus buy aggressors. CVD used to gauge real-time market pressure and sentiment, which is crucial for short-term trading and identifying potential reversals. It provides potential scenario’s which can be used to identify key market anticipated moves.
NPOC Levels (BTC)
NPOC (Naked Point Of Control) aids in identifying key areas with significant remaining liquidity, enabling us to see where whales left most unrealised orders. NPOC levels consistently act as price magnets, with the price closing them in over 85% of cases. These levels often signal reversals, but can also indicate continuation. Primarily, they serve as valuable tools for placing limit buy and sell orders, as well as predicting the likely direction of the price in the subsequent move.
Daily
All NPOC levels open onward are new .
Above : 63k , 64k and above.
Below : Current price is at the Daily NPOC 58400 and 48k price level.
4 Hr
Above : 60300 , 61900 , 62800 and Above
Below : — — (No Npoc below here)
As one of our anticipation , the lower 4hr NPOC rested at 57350 were tagged and price have had nice counter upside reaction post that. Adding that , if buyers continues to have strength , there’s higher chances of the sub 60k NPOC would be tagged.
Funding rate:
0.0048% , With the recent move , higher funding is observed across the board, this suggest some large no. of margin participants jumped into the market .
Note : Low funding rates are a positive indicator, suggesting that the market isn’t overheated. However, it's crucial to wait for additional confirmation signals, such as the closing of NPOCs or increased spot buying, before considering this as a buying opportunity. On the upside, the lack of overleveraging in the market suggests that we are unlikely to see significant liquidation cascades.
Exchange balance: Inflows and Outflows from exchanges :
Throughout the sideways , continous outflows were observed that suggested some accumulation continously happening .
Note: Positive net flows indicate more Bitcoin coming into the exchange than leaving, while negative net flows suggest more Bitcoin leaving the exchange than entering.
Aggregated Exchanges Liquidation Levels
Liquidity Map Distribution : (LTF past 24hr liquidity ranges between)
Daily : showing compressed and narrow in liquidity range , Some large leverage liquidity below the current price resting at 58.5k area.
Weekly : Both side liquidity is resting , however upside s more extended toward 63k
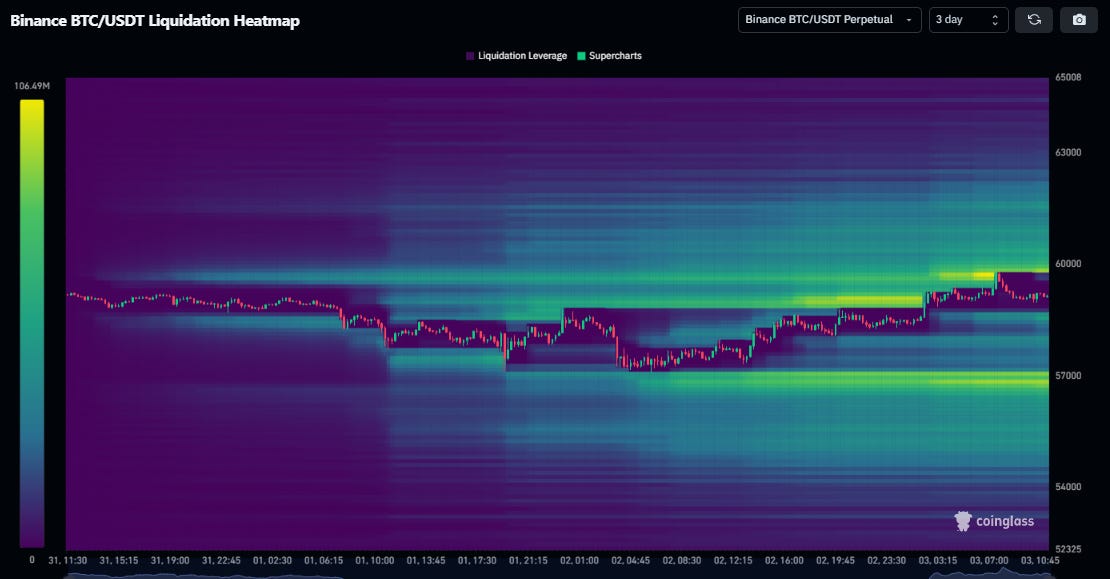
Coin-Glass Heatmap
3D : 60K Liquidity clusters has been tagged . While some showing below around 57k.
Weekly :
Note : Liquidation level & Heatmap aggregates the price levels at which large-scale liquidation events may occur. A liquidation event occurs when a trader's positions are closed due to price fluctuations .
Liquidation Levels (Tier 0)
Total Liquidations: Long 204, Short 209
Active Long posi. size : $ k 11.2k
(Tier 1) , Lower granularity level ,
Total Liquidations: Long 31, Short 28
Active Short posi. size : $ k 17.29
Observation :
Along with the Bullish CVD actions , we see some the positioning shifting to the buyers control , leads to vanishing the short liquidations .
Conclusive Insight:
Daily
As price were hovering in the unclear zone , some LTF buyers jumped in and pushes the price printing bullish engulf in the Daily candle. However the bias still unclear as the daily str. dont see shift in the overall structure . Bearish sentiment still persist.
While everything points to accumulation, it's difficult to interpret whether this is accumulation before a drop or a rise.
Funding has reset, liquidation levels and liquidity are above the current price, and we see outflows—all of which are very bullish. We observed some buyers footprint in LTF which could built up to take out the upside liquidity further.
It’s still highly likely that we will see one final major price drop to shake out retail traders unless there’s some positive response from the Buyers strength observed.
**We had our limit buys at the daily NPOCs, but have now sold and are positioned neutrally. For any further long positions, we want to see more convincing market data and a bullish trend**
Subscribe to our newsletter and we'll deliver it straight to your email.
Until next time, Happy trading, and stay tuned for more updates.


