


Bitcoin slipping after tapping ATH region , is Retracement Over??
BTC Quant Newsletter

We prepare a daily quant report for our trading desk, which helps us trade Bitcoin.
The report includes a range of essential statistical data such as spot and margin CVD, NPOC levels, exchange flows, funding rates, and liquidation levels.
It is designed to assist all traders in predicting upcoming market movements based on fundamental data. By combining the analysis of CVD data with liquidity, we can confidently anticipate the next price movement. Our approach in this report is geared towards the medium term, providing the opportunity to forecast price movements for the next 2 to 4 days.
We are pleased to share this report with you, along with our interpretation of the data.
Lets delve into this:
Tips : if you read daily , you will find an extraordinary edge on reading market state.
BTC CVD CHART
15m to Daily Time Frame
15m
Price: selling
Spot CVD : shows sligh buys but it overall into selling zone.
Margin CVD : selling

Overall all LTF cvds still selling and pulling price lower.
1Hr
Price : selling
Spot CVD: selling
Margin CVD : Selling
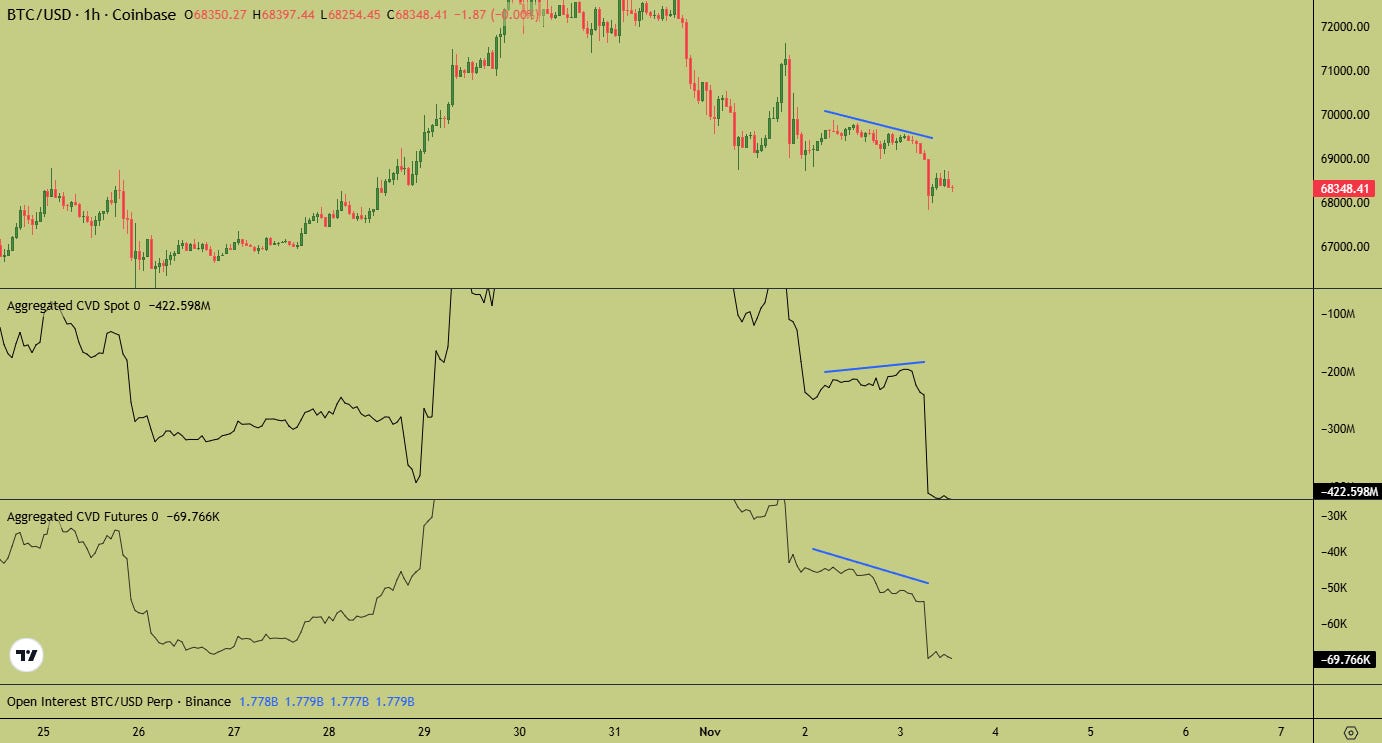
Same 15tf behaviour reflecting here in 1 hr . Market shifted downside and sell pressure still showing from the cvd participants.
4Hr
Price : selling
Spot CVD: selling
Margin CVD: selling

CVD shifted downside and aggressively selling too in 4hr time.
Daily
Price : selling
Spot CVD: Selling
Margin CVD: Selling

Observation :
Attesting previous report observation here , Margin starts showing selling divergence, which is now still extended downside . Overall CVD’s from LTF to HTF is selling .
Note : Cumulative Volume Delta (CVD) displays the cumulative volume changes based on the volume traded by sell aggressors versus buy aggressors. CVD used to gauge real-time market pressure and sentiment, which is crucial for short-term trading and identifying potential reversals. It provides potential scenario’s which can be used to identify key market anticipated moves.
NPOC Levels (BTC)
NPOC (Naked Point Of Control) aids in identifying key areas with significant remaining liquidity, enabling us to see where whales left most unrealised orders. NPOC levels consistently act as price magnets, with the price closing them in over 85% of cases. These levels often signal reversals, but can also indicate continuation. Primarily, they serve as valuable tools for placing limit buy and sell orders, as well as predicting the likely direction of the price in the subsequent move.
Daily
Above : 71k , 73k (Tagged) ,
Below : 69k (tag) while below open 68k , 61k

4 Hr
Above : 72k
Below : 68k-67k open
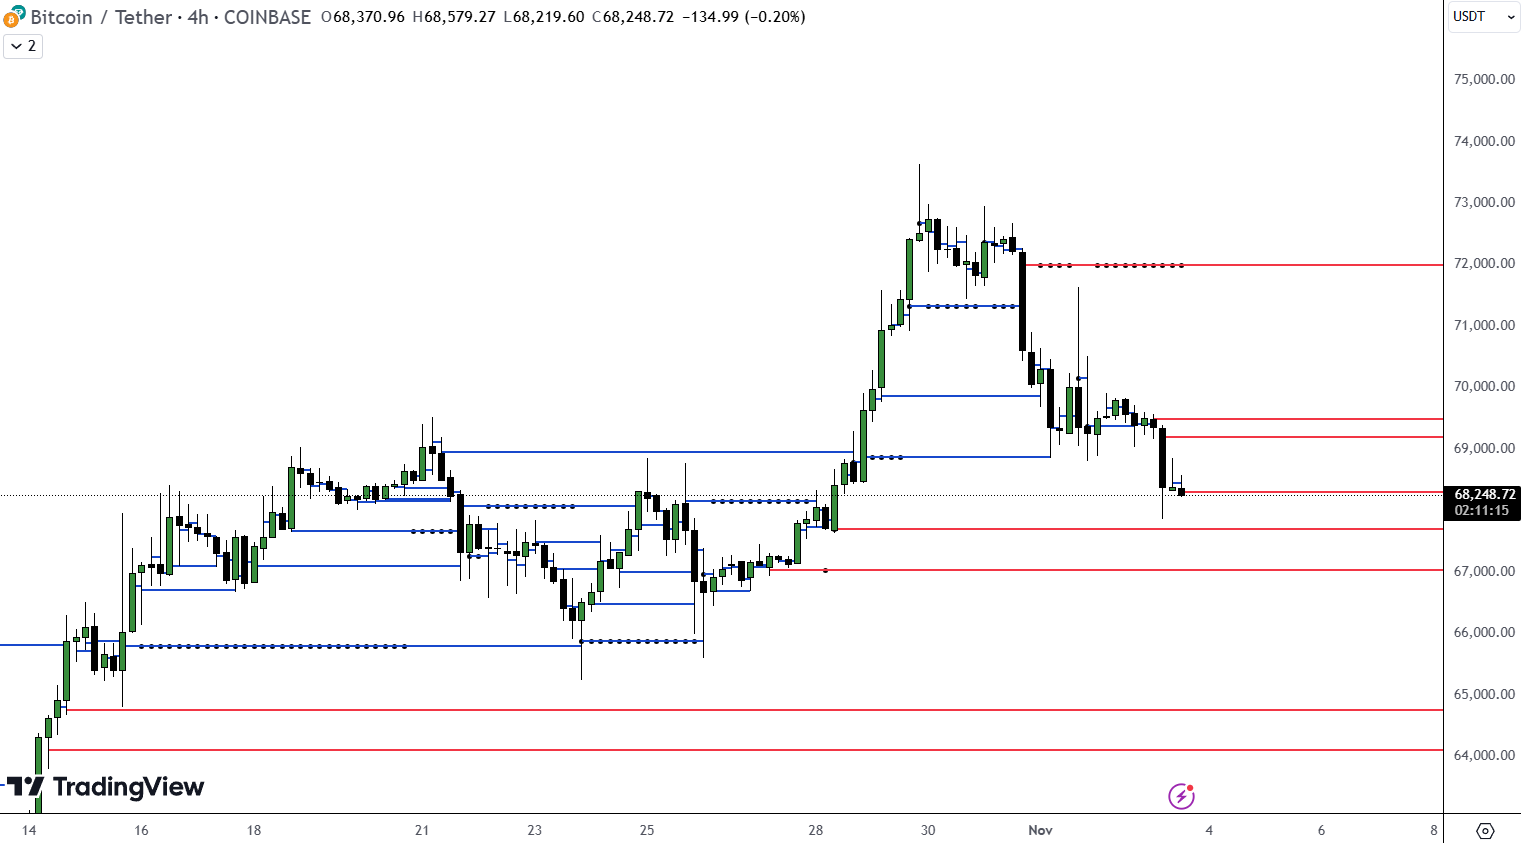
Major NPOC 71k , 73k upside tagged
Funding rate:
0.099% , Funding slight dropped with yesterday drop however it still higher overheated zone , no reset yet, suggests long margin participants are paying higher fees to be in the long side.

BTC OI weighted funding :
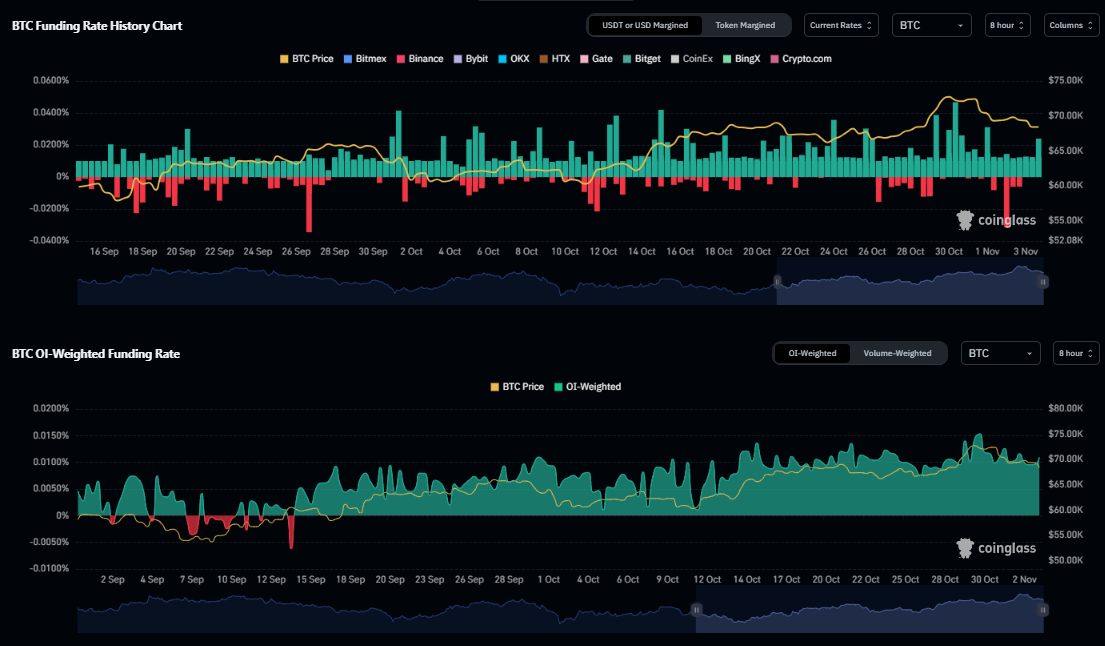
Note : Low funding rates are a positive indicator, suggesting that the market isn’t overheated. However, it's crucial to wait for additional confirmation signals, such as the closing of NPOCs or increased spot buying, before considering this as a buying opportunity. On the upside, the lack of overleveraging in the market suggests that we are unlikely to see significant liquidation cascades.
Exchange balance: Inflows and Outflows from exchanges :
Some inflows observed since price peaked , however it was still minor sell pressure.

Note: Positive net flows indicate more Bitcoin coming into the exchange than leaving, while negative net flows suggest more Bitcoin leaving the exchange than entering.
Aggregated Exchanges Liquidation Levels
Liquidity Map Distribution : (LTF past 24hr liquidity ranges between)
Daily : Liquidity is narrowed and higher both side.

Weekly : Tons of lower side liquidity taken out , while on the opposite side (upside) starts building lev liquidity
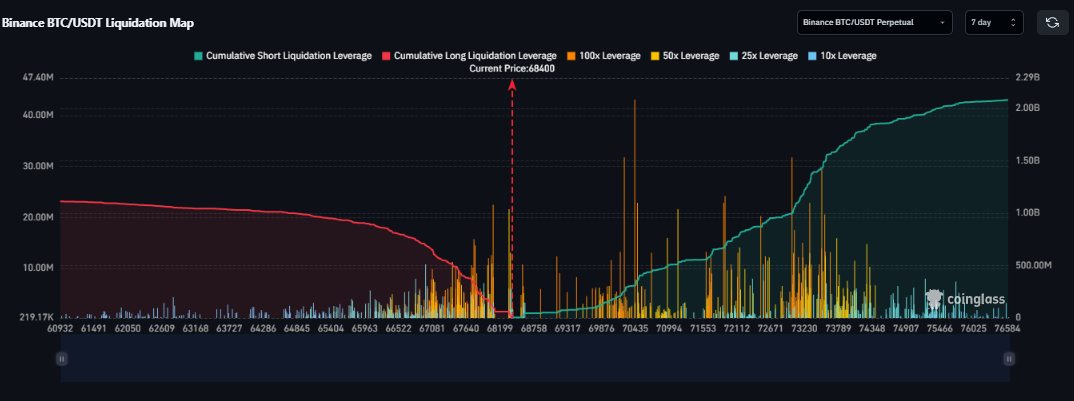
Monthly : No changes in the Monthly levels too , Filtered out 25x , 10x and 5x level , current display level shows 50x and 100x leverage open positions , in which some bunch of short positions opened at current range with its liquidations

Coin-Glass Heatmap
Daily : upside sub 70k shows bright liquidity
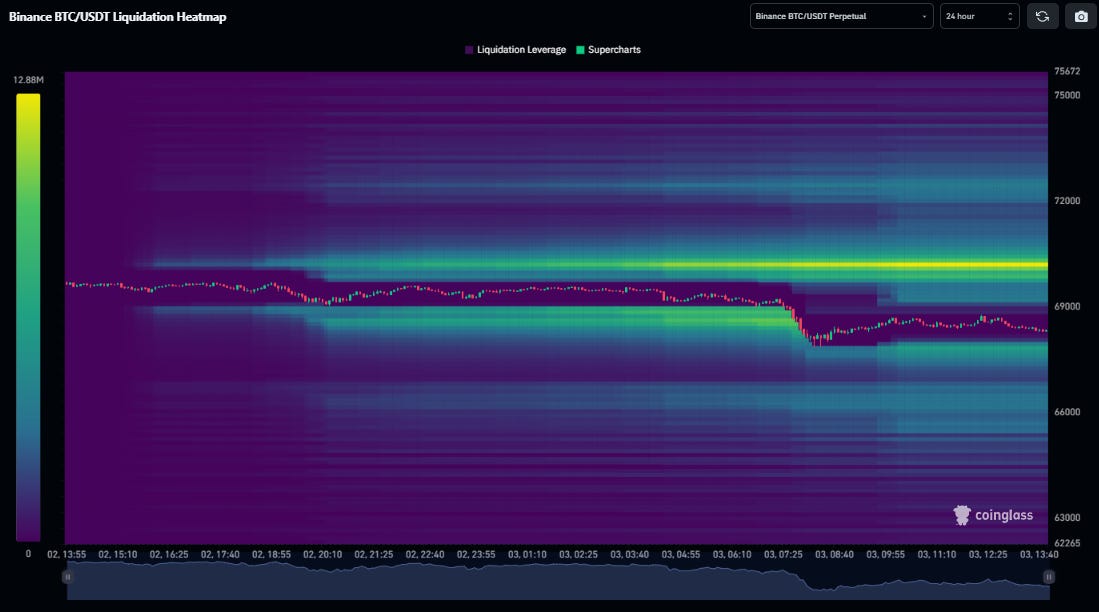
3 Day :

With yesterday drop , some upside bright cluster liquidity popped up in LTF that could be taken if price made mean reversion move.
Note : Liquidation level & Heatmap aggregates the price levels at which large-scale liquidation events may occur. A liquidation event occurs when a trader's positions are closed due to price fluctuations .
Liquidation Levels (Tier 0)
Total Liquidations: Long 53 , Short 478
Active Long posi. size : $ k 774

(Tier 1) , Lower granularity level ,
Total Liquidations: Long 8, Short 112
Active Short posi. size : $ k 320

Observation :
Short taken the overall skew into its control , while it increases to $700k worth of liquidation average to per position that is quite large and its suggest price is over extended to downside.
While positional skew is also largely skewed with 8 shorts per long , which is extreme overstreched to one side , price would tend to mean revert to rebalance the inefficient skewed .
Tier 2 liquidation reflecting the same dynamic here
Conclusive Insight:
Daily

Daily
As Price peaked , Margin started showing weakness and which now leads the price to falls from ATH Resistance level. Currently from price action point of view, market is at key daily support at 68200 , this level could give some intraday bounce, holding till 66k could still keep market in bullish str. However loosing this zone could shift market to downside bias .
Funding dropped slight but its still higher , Some slight inflows observed with downside move that was slight though, which may not matter by alot , but additional ETF sub $800mln worth of inflows give some accumlation suggestion from the whale participants.
while during price retracement tons of long positions were liquidated which can be observed by the erosion of liquidity in liquidation Map .
Short Liquidation skew is overextended to the downside.
Heatmap showing upside liquidity above current price . Any jump of buyers would give bullish reversion possibility in the price.Our next Report will be published on Tuesday . Enjoy Weekends !!
Subscribe to our newsletter and we'll deliver it straight to your email.