


BTC Ranging and Absorbing Sell pressure , Will it keep its Uptrend strong ??
BTC Quant Newsletter

We have prepared a concise Quant report to assist you in navigating through Bitcoin and Crypto markets.
This report includes some essential data stats like spot and margin CVD charts, NPOC levels, Exchange Flows, Funding rates, and liquidation levels.
It is designed to assist all traders in predicting upcoming market movements based on fundamental data. By combining the analysis of CVD data with liquidity, we can confidently anticipate the next price movement. Our approach in this report is geared towards the medium term, providing the opportunity to forecast price movements for the next 2 to 4 days.
Towards the end of each data set, we have provided observations on the approach to the market. we hope this provides you with valuable insights as you read through.
Lets delve into this:
Tips : if you read daily , you will find an extraordinary edge on reading market state.
BTC CVD Charts
15m
Spot CVD: Bear
Margin CVD: Bull

1Hr
Spot CVD: Neutral
Margin CVD : Neutral

4Hr
Spot CVD: Neutral
Margin CVD: Neutral

Daily
Spot CVD: Neutral
Margin CVD: Neutral

LTF CVD building bear divergence in the prices but HTF cvd charts are neutral and no any large deflection built yet.
Note : Cumulative Volume Delta (CVD) displays the cumulative volume changes based on the volume traded by sell aggressors versus buy aggressors
Bullish divergence indicates a potential reversal to the upside ,
While Bearish divergence suggests weakening upward momentum.
NPOC Levels (BTC)
NPOC (Naked Point Of Control) aids in identifying key areas with significant remaining liquidity, enabling us to see where whales left most unrealised orders. NPOC levels consistently act as price magnets, with the price closing them in over 85% of cases. These levels often signal reversals, but can also indicate continuation. Primarily, they serve as valuable tools for placing limit buy and sell orders, as well as predicting the likely direction of the price in the subsequent move.
Daily
Above : 65000 (Tagged), 67000 (Tagged) , 71000 (Tagged), 73400 (Open)
Below : 67000 (New Open), 62000 ( Open)
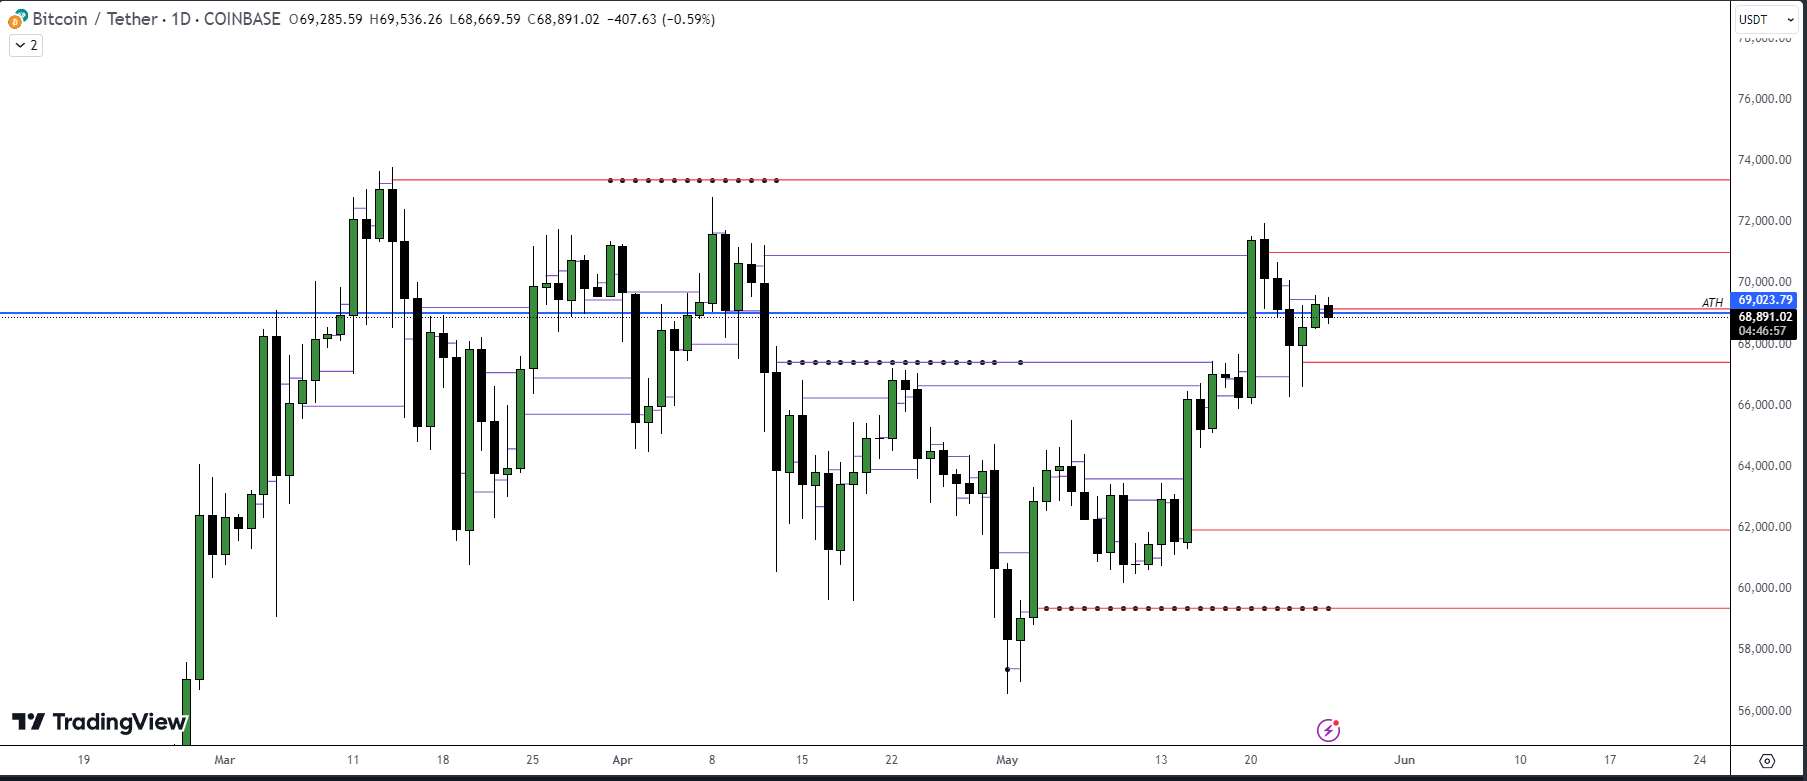
4hr
Upside : 71200 , 73200
Downside : 68400, 67000

ETH Daily
Above : 3900 , —
Below : 3100

Funding rate:
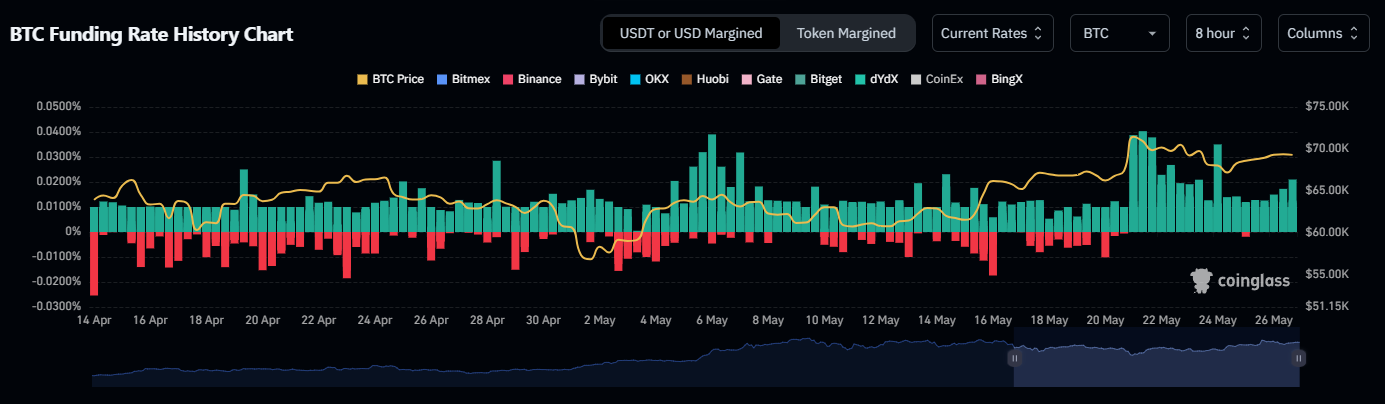
With the recent upside in the BTC price, Funding increased too by large margin and continously printing Positive funding rate across all the major exchanges.
Note : Funding represents periodic payments between Long and Short position participants in a perpetual futures contract. A deviation from neutrality suggests an imbalance in market positioning by one side of traders which must needs to rebalance.
Positive funding means positions are dominated by Long side participants , Negative funding means positions are dominated by Short side participants.
Traders closely monitor funding rates for strategic decision-making.
Exchange balance: Inflows and Outflows from exchanges
With the ranging going on , Inflows are consistent to exchanges . These all inflows are being absorbing by the prices .

Note: Positive net flows indicate more Bitcoin coming into the exchange than leaving, while negative net flows suggest more Bitcoin leaving the exchange than entering.
Aggregated Exchanges Liquidation Levels
Liquidity Map Distribution : (LTF past 24hr liquidity ranges between)
Current orderbook liquidity is compressed to very narrow range and ranging only between 67.8k to 70.8k
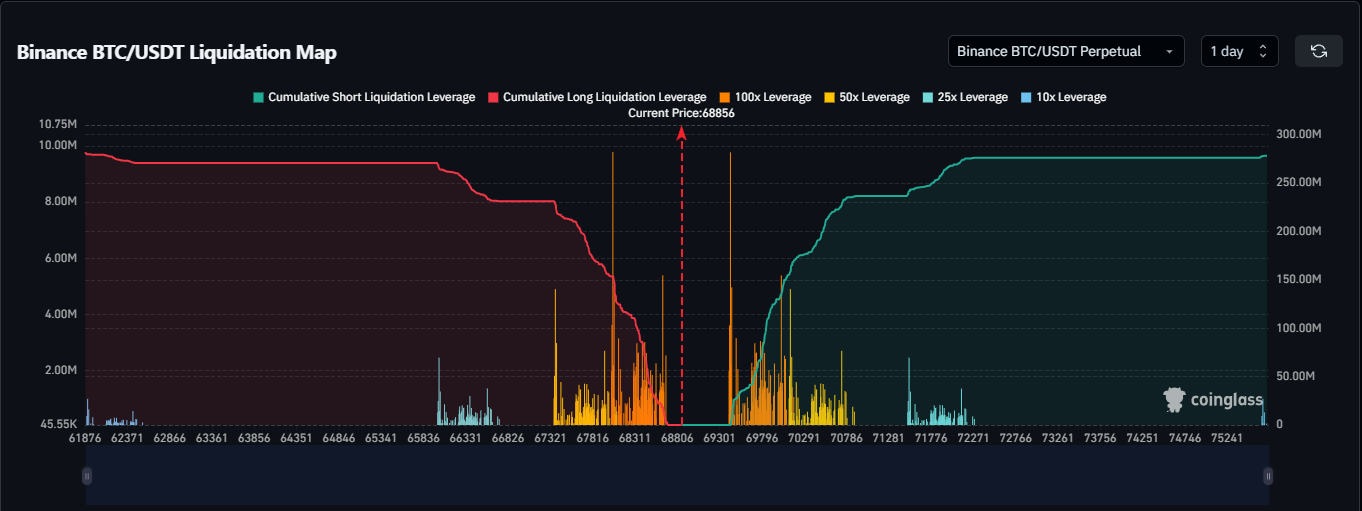
Note : This shows nearest liquidity residing around exchanges.
X-axis represents the mark price, while the Y-axis represents the relative intensity of liquidation.
Higher "liquidation bars" indicate a stronger reaction due to a surge in liquidity.
Liquidation Levels (Tier 0)
Total Liquidations: Short 179, Long 148
Active Long posi. size : $ k 49
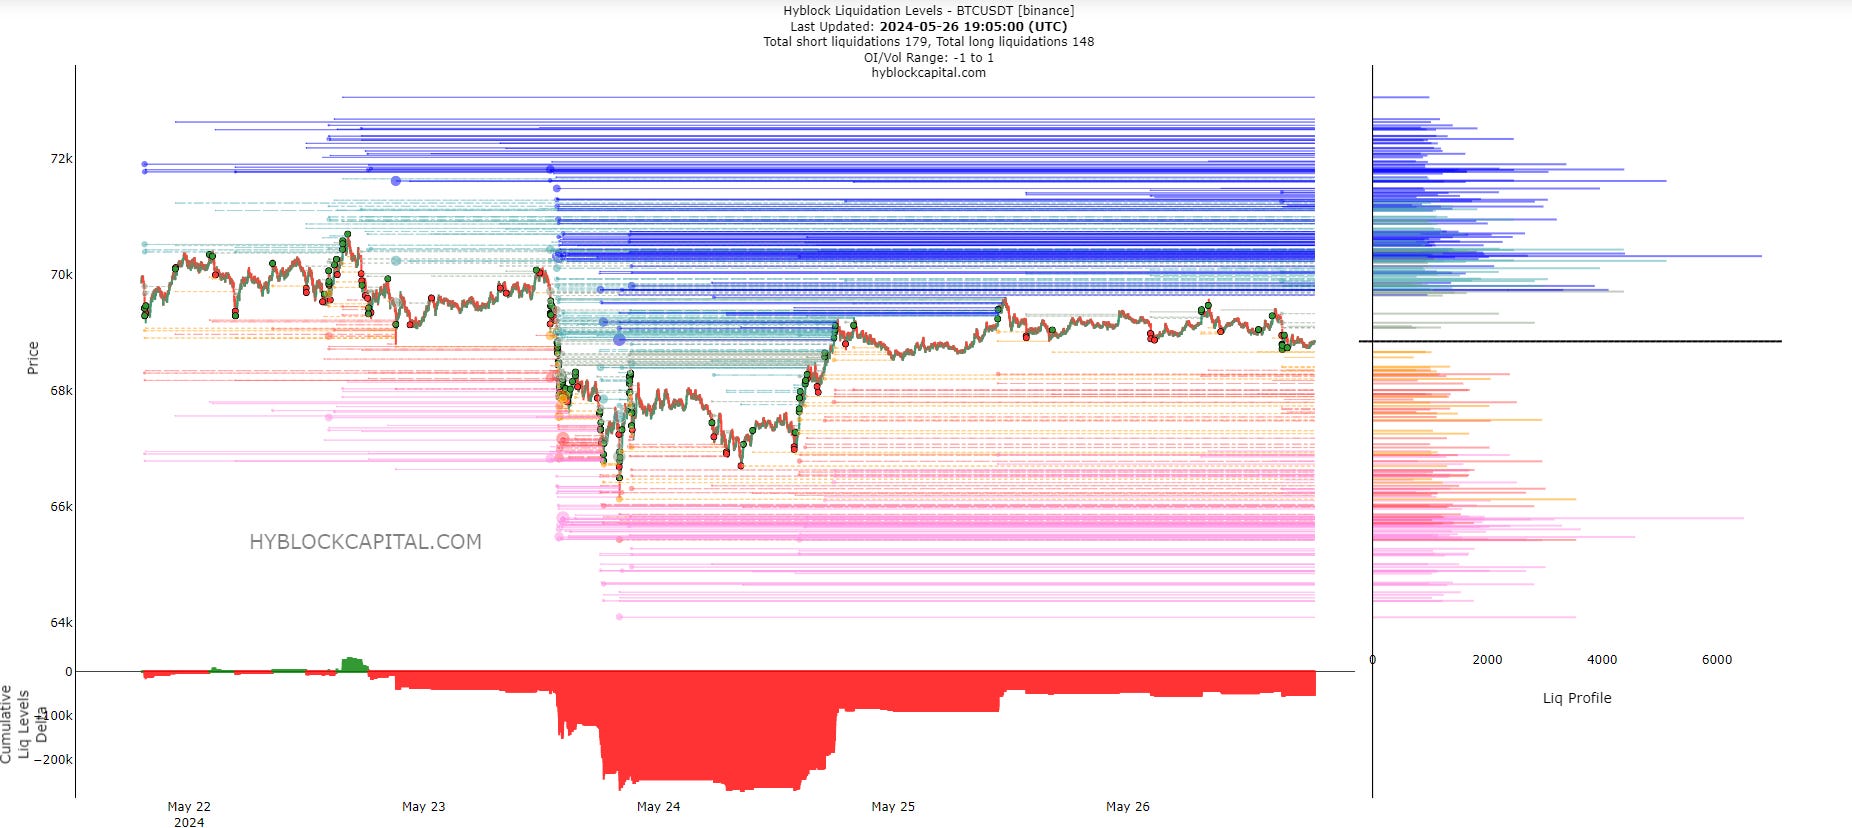
(Tier 1)
Total Liquidations: Short 52,Long 39
Active Short posi. size : $ k 42

Observation :
Skew is rebalanced to much extent , while the liquidation is tilt toward short traders with the opening liquidation of only 49k per position , that means the skew between the long and the short traders are flat here, and no positions are aggressive to another.
Coinglass Heatmap
liquidity cluster above resting at 72k

Note : Liquidation level & Heatmap predicts the price levels at which large-scale liquidation events may occur. A liquidation event occurs when a trader's positions are closed due to price fluctuations and their margin account balance is insufficient to cover the open positions
Traders who can estimate the liquidation levels of other traders may gain an advantage similar to understanding high liquidity in the order book.
Conclusive Insight:
BTC Daily :

23rd May Price Action Daily :

CVD is printing bear divergence in the LTF 15min chart only , where price only buying but spot not assisting . However HTF CVD is neutral . its crucial to watch if this divergence in LTF will built in HTF too. For now positioning looks flat and only further clear development with the price make the scenerio more clear.
Looking to other data , funding is high , Continous Inflows of the BTC which is being absorbed by the current price . However Liquidation skew is neutral and Heatmap still showing bright liquidity above 72k level confluence with Npoc which is resting at sub 73k level . If BTC kept able to hold strong into its position and price expand upside , it will take above liquidity first .
Follow us for receiving our valuable report on each alternate days, Advantage ? You keep able to gauge and sync with the state of the market . , If you are new to this , Must Request to read our previous report too : 23rd May BTC Quant Report Newsletter
Subscribe to our newsletter and we'll deliver it straight to your email.
Until next time, Happy trading, and stay tuned for more updates.