


BTC : Hovering Below ATH , Will it breach Today ?
BTC Quant Newsletter

We have prepared a concise Quant report to assist you in navigating through Bitcoin and Crypto markets.
This report includes some essential data stats like spot and margin CVD charts, NPOC levels, Exchange Flows, Funding rates, and liquidation levels.
It is designed to assist all traders in predicting upcoming market movements based on fundamental data. By combining the analysis of CVD data with liquidity, we can confidently anticipate the next price movement. Our approach in this report is geared towards the medium term, providing the opportunity to forecast price movements for the next 2 to 4 days.
Towards the end of each data set, we have provided observations on the approach to the market. we hope this provides you with valuable insights as you read through.
Lets delve into this:
Tips : if you read daily , you will find an extraordinary edge on reading market state.
BTC CVD Charts
15m
Spot CVD: Bullish
Margin CVD: Neutral
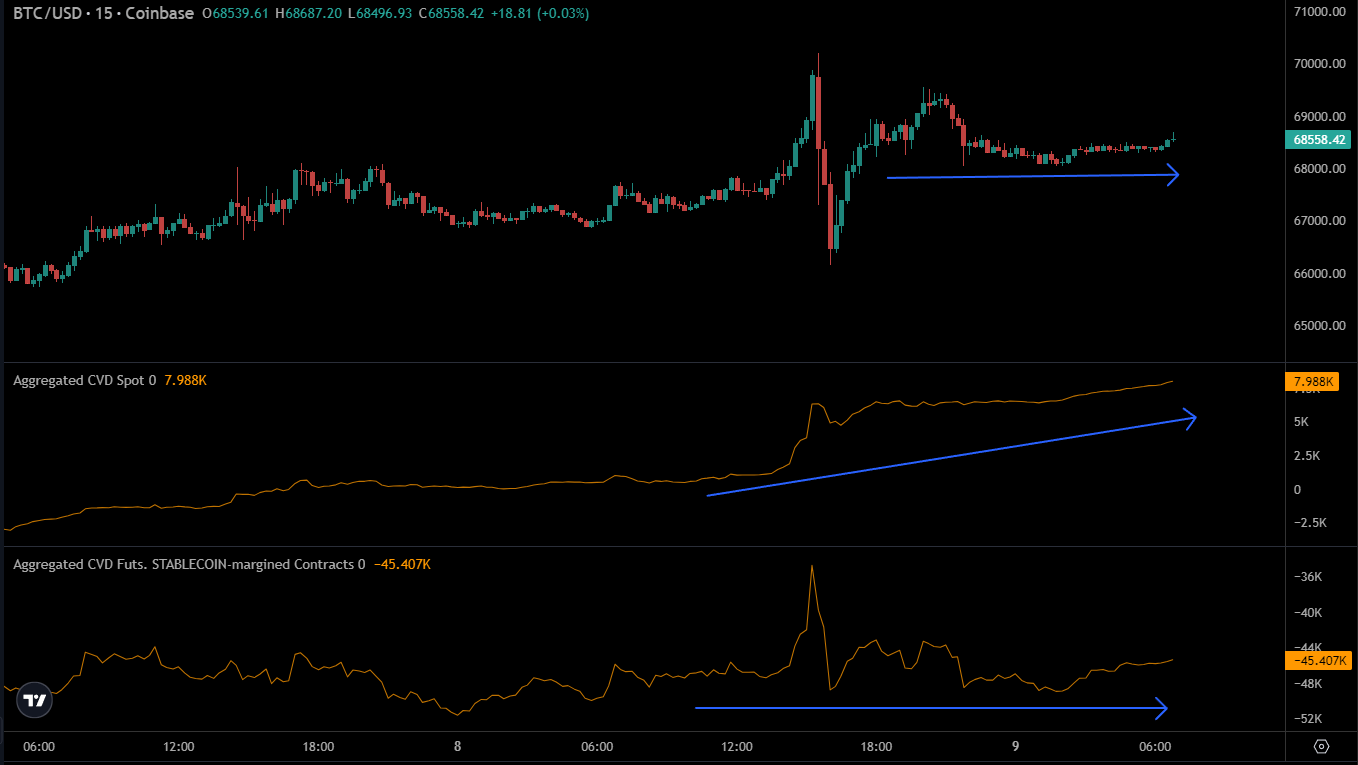
Spot traders are buying BTC confidently , while Margin traders are flat with their position not showing any aggressive to any side .
1Hr
Spot CVD: Bullish
Margin CVD : Neutral

Since price made dump , Spot BTC price developing strongly and efficiently because of Spot traders buying.
4Hr
Spot CVD: Bullish
Margin CVD: Neutral

Daily
Spot CVD: Bullish
Margin CVD: Neutral

Observation :
Spot consistently leading the post dump move , price development suggests growth in BTC price is totally leading by Spot traders , which is generally healthy sign for the price growth.
Note : Cumulative Volume Delta (CVD) displays the cumulative volume changes based on the volume traded by sell aggressors versus buy aggressors
Bullish divergence indicates a potential reversal to the upside ,
While Bearish divergence suggests weakening upward momentum.
NPOC Levels (BTC)
NPOC (Naked Point Of Control) aids in identifying key areas with significant remaining liquidity, enabling us to see where whales left most unrealised orders. NPOC levels consistently act as price magnets, with the price closing them in over 85% of cases. These levels often signal reversals, but can also indicate continuation. Primarily, they serve as valuable tools for placing limit buy and sell orders, as well as predicting the likely direction of the price in the subsequent move.
Daily
Above : No New nPOC open Upside , All Time High Above
Below : 57000 , 52000 & Lower

4hr*
Above : - -
Below : 66000

ETH Daily nPOC chart
Above :
Below : 3800 (New Open)
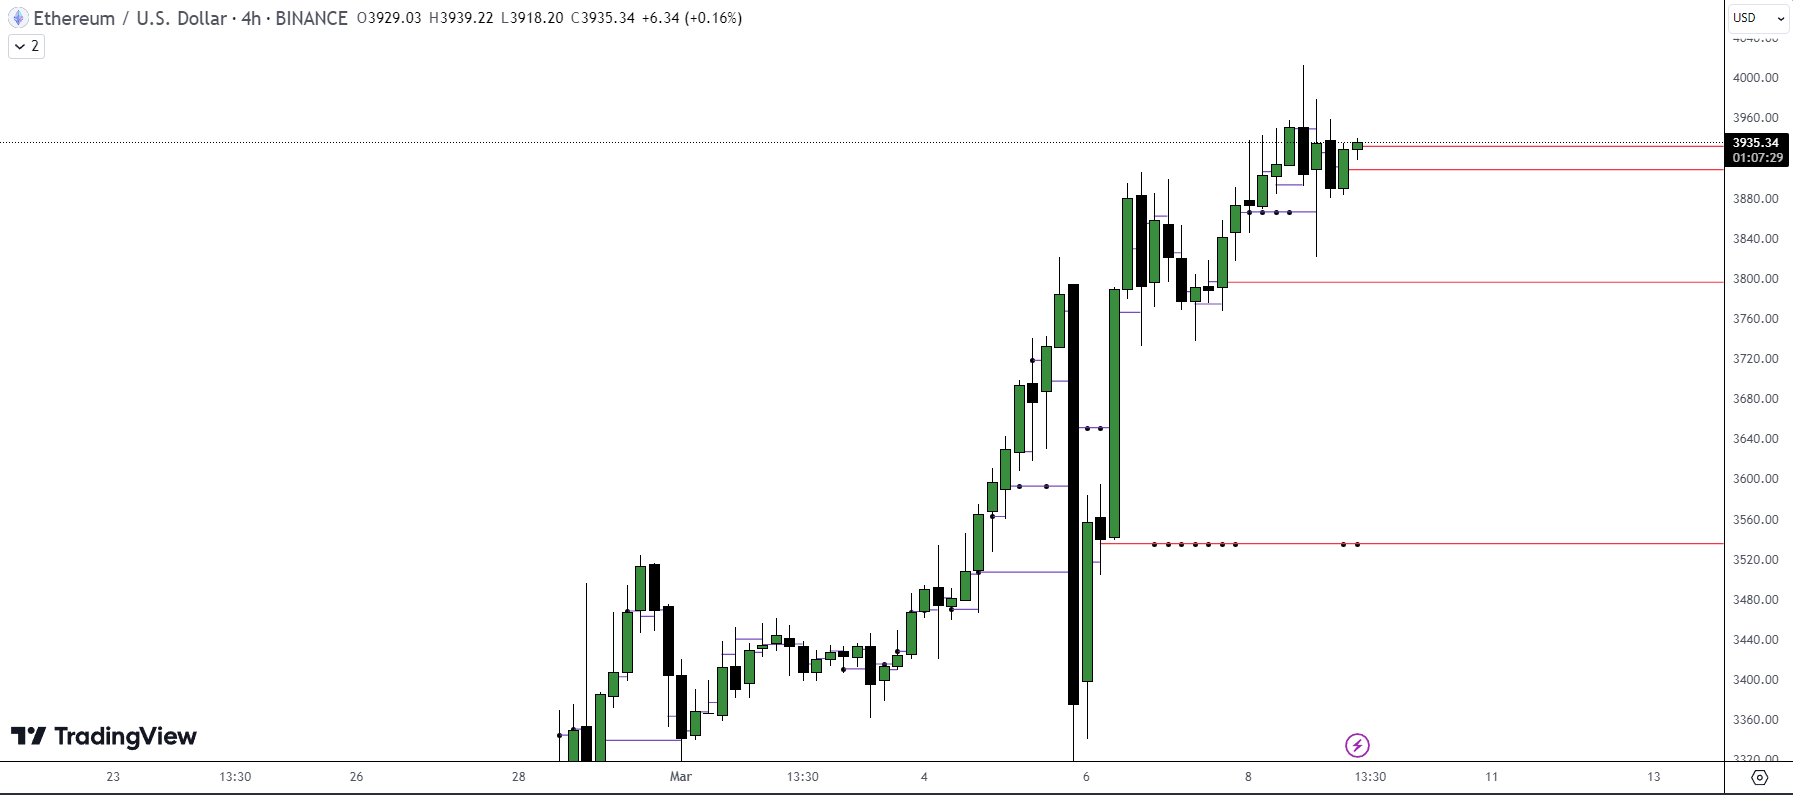
Observation :
Open liquidity above .
Funding rate:
OI Weighted Funding: 0.0285%

Funding lowered , Adjusted into average funding zone , meanwhile price efficiently developing upside ,just below ATH.
Note : Funding represents periodic payments between Long and Short position participants in a perpetual futures contract. A deviation from neutrality suggests an imbalance in market positioning by one side of traders which must needs to rebalance.
Positive funding means positions are dominated by Long side participants , Negative funding means positions are dominated by Short side participants.
Traders closely monitor funding rates for strategic decision-making.
Exchange balance: Inflows and Outflows from exchanges
16k Daily Outflow

Again large outflow observed suggesting big wallets are accumulating BTC
Note: Positive net flows indicate more Bitcoin coming into the exchange than leaving, while negative net flows suggest more Bitcoin leaving the exchange than entering.
if our report helps you out to gauge the market state , Give a follow and appreciate our work!!
Subscribed
Aggregated Exchanges Liquidation Levels
24hr Liquidity Map Distribution : (LTF past 24hr liquidity ranges between)
Upside : 68800 - 71400
Downside: 67400 - 65400

LTF manipulation and cascade of price liquidating high leverage position leads to lighter depth in liquidity in the nearest price zone , which also indicate price could now target large move to take out residing liquidity .
Note : This shows nearest liquidity residing around exchanges.
X-axis represents the mark price, while the Y-axis represents the relative intensity of liquidation.
Higher "liquidation bars" indicate a stronger reaction due to a surge in liquidity.
Liquidation Levels (Tier 0)
Total Liquidations: Short 70, Long 237
Active Long posi. size : $ k 342

(Tier 1)
Total Liquidations: Short 58,Long 222
Active Short posi. size : $ k 336

After restting of all Funding , Liquidation Skew imbalance , positioning of trades are in the control of long participants with each position having $336k liquidity open.
Liquidation Heatmap
Weekly:
Upside : 75k
Downside : 60k

12 Hr
Upside : 69k - 70k
Downside : 67k - 66k

CoinGlass Weekly Heatmap

Note : Liquidation level & Heatmap predicts the price levels at which large-scale liquidation events may occur. A liquidation event occurs when a trader's positions are closed due to price fluctuations and their margin account balance is insufficient to cover the open positions
Traders who can estimate the liquidation levels of other traders may gain an advantage similar to understanding high liquidity in the order book.
Conclusive Insight:
First of all just to make it easy for you, we will request you must not miss reading any of our report, data are closely interlinked with each other, continuity helps you to understand the overall shift in the price microstructure state .
BTC 4hr TF

We are hovering just below All Time High , with price development totally in control and lead by spot traders , while Funding and Skew are resetted and rebalanced . This all could suggest price could target and make large expansionary move to take of large liquidity cluster. Here based on the data, Upside expansion are most predictable , However we are at very key and important level , so we should have close eye on the price development forward.
Follow us for receiving our valuable report on each alternate days, Advantage ? You keep able to gauge and sync with the state of the market . , If you are new to this , Must Request to read our previous report too : 7th Mar BTC Quant Report Newsletter
Subscribe to our newsletter and we'll deliver it straight to your email.
Until next time, Happy trading, and stay tuned for more updates.